
App status allows to simply monitor external services performance, including cache efficiency. The overhead of service monitoring should be very low, but don't use this on very simple code (no external calls, single line implementation, ...), where overhead could become significant.
Service performance monitoring is modular feature of App Status. This allows to implement custom persistence for these data.
App Status provides a default implementation, appstatus-services-inprocess, which stores data in the current JVM. This means the overhead is very small but data are not shared between JVMs if your application runs on multiple servers and are lost when the application stops.
<dependency>
            <groupId>net.sf.appstatus</groupId>
            <artifactId>appstatus-services-inprocess</artifactId>
            <version>0.0.9</version>
            <scope>compile</scope>
</dependency>
Call appstatus before and after calls
IServiceMonitor monitor = AppStatusStatic.getInstance().getServiceMonitor( name, group) ;
try {
	monitor.beginCall();

	// If cache is used :
	monitor.cacheHit();

	// else perform some work here
	Object result = doWork();

	// On error
	if( isError(result) )
		monitor.error( "returned error");

}catch( Exception e) {
	monitor.failure( "Exception", e );
	throw e;
} finally {
	monitor.endCall();
}
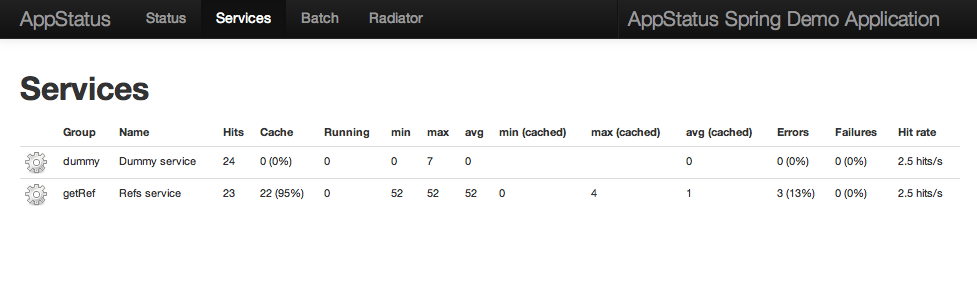
AppStatus will now monitor : hits, cache hits, running calls, min/max/avg times with and without cache, errors and failures.
Go to http://<server>/<app-context>/status?p=services :
AppStatusServiceInterceptor can provide AppStatus monitoring features without changing any code. Just define the interceptor bean and target the methods using a pointcut:
  <bean id="appStatusInterceptor"
  		class="net.sf.appstatus.support.spring.AppStatusServiceInterceptor"
  		scope="singleton">
          <property name="appStatus" ref="appStatus" />

          <!-- Optional property for dynamic activation -->
          <property name="activationCallback" ref="activationCallback" />

          <!-- Optional property for logger selection -->
          <property name="logger" value="<logger-name>" />

          <!-- Optional property for monitor setup -->
          <property name="preServiceCallback" ref="preServiceCallback" />

          <!-- Optional property for service result analysis -->
          <property name="postServiceCallback" ref="postServiceCallback" />

  </bean>

   <aop:config >
          <aop:advisor id="serviceCallAdvisor"
          		advice-ref="appStatusInterceptor"
          		pointcut="execution(public * your.package.ServiceClient*.*(..))" />
</aop:config> Appstatus can put the service monitor in a thread local to make it available deeper in the code, even if you can't pass it as a parameter. See ServiceMonitorLocator.getCurrentServiceMonitor().
Appstatus provides a Spring cache (AppStatusCacheManager), which wraps any other cache implementation (ehcache, ConcurrentMap) and automatically call monitor.cacheHit() when the cache returns a value.
Automatically add service calls logging with custom formating. Can be used for performance/SLA logging. The following values are available:
Default log format is
${correlationId}|${group}|${name}|${responseTime}|${cache}|${status}|${statusMessage}